Examples & CPM vs. CCPM Walkthrough
This guide provides a complete, step-by-step example comparing a traditional Critical Path Method (CPM) schedule against a Critical Chain Project Management (CCPM) schedule generated by ccpm-scheduler.
It demonstrates how ccpm-scheduler takes raw input networks, strips task-level safety padding, levels resource bottlenecks, inserts explicit project and feeding buffers, and compares the impact of the three buffer sizing methods (cap, hchain, and rsem).
1. Input Project Network
Consider a typical software release project ("Website Launch") with 8 tasks across 5 specialized roles (writer, designer, dev, editor, qa).
tasks.csv
Task duration estimates contain standard 80-90% safe estimates (realistic_duration):
id,name,realistic_duration,predecessor_ids,resource_ids,url
W1,Content outline,6,,writer,https://example.com/tickets/W1
W2,Draft copy,10,W1,writer,https://example.com/tickets/W2
W3,Design mockups,8,W1,designer,https://example.com/tickets/W3
W4,Build frontend,12,W3,dev,https://example.com/tickets/W4
W5,Build backend,16,,dev,https://example.com/tickets/W5
W6,Integrate,8,W4;W5,dev,https://example.com/tickets/W6
W7,Edit copy,6,W2,editor,https://example.com/tickets/W7
W8,Load content,4,W6;W7,writer,https://example.com/tickets/W8
W9,Launch QA,6,W8,qa,https://example.com/tickets/W9
resources.csv
Per-resource capacities (each role has a single person available):
id,name,capacity,url
writer,Content writer,1,https://example.com/teams/writer
designer,UI designer,1,https://example.com/teams/designer
dev,Developer,1,https://example.com/teams/dev
editor,Copy editor,1,https://example.com/teams/editor
qa,QA engineer,1,https://example.com/teams/qa
2. Traditional Critical Path (CPM) Schedule
In traditional Critical Path scheduling:
- Padded Durations: Tasks are scheduled using their full, padded
realistic_durationestimates (totaling 46 working days along the primary path). - Hidden Safety: Safety padding is hidden inside each task estimate. Because of Parkinson's Law ("work expands to fill the time allotted") and Student Syndrome ("procrastination until deadlines"), this safety is typically wasted.
- Unprotected Merges: Feeding chains (e.g., content drafting) merge directly into developer tasks without feeding buffer protection.
gantt
    title Traditional Critical Path (CPM) Schedule (Total: 46 Working Days)
    dateFormat X
    axisFormat %s
    section Primary Chain (Critical Path)
    W5 Build backend (16d)     :crit, w5, 0, 16d
    W4 Build frontend (12d)    :crit, w4, after w5, 12d
    W6 Integrate (8d)          :crit, w6, after w4, 8d
    W8 Load content (4d)       :crit, w8, after w6, 4d
    W9 Launch QA (6d)          :crit, w9, after w8, 6d
    section Non-Critical Paths
    W1 Content outline (6d)    :w1, 0, 6d
    W3 Design mockups (8d)     :w3, after w1, 8d
    W2 Draft copy (10d)        :w2, after w1, 10d
    W7 Edit copy (6d)          :w7, after w2, 6d
3. Critical Chain (CCPM) Schedule
When ccpm-scheduler processes this network:
- Aggressive Durations: Task durations are cut to 50% aggressive estimates (
optimal_duration = realistic_duration / 2) to eliminate Parkinson's Law and encourage relay-runner handoffs. - Resource Leveling & Late-Start (ALAP): Tasks assigned to shared resources (e.g.,
devworking on W5, W4, and W6) are leveled to prevent resource double-booking, and scheduled as late as possible. - Critical Chain Identified: The longest sequence of dependent tasks including resource dependencies becomes the Critical Chain (
W5 → W4 → W6 → W8 → W9), taking 23 active working days. - Buffer Aggregation: Extracted safety padding is pooled into explicit Project Buffers (PB) and Feeding Buffers (FB).
gantt
    title Critical Chain (CCPM) Schedule (Active Work: 23 Days + Buffers)
    dateFormat X
    axisFormat %s
    section Critical Chain
    W5 Build backend (8d)      :crit, w5, 0, 8d
    W4 Build frontend (6d)     :crit, w4, after w5, 6d
    W6 Integrate (4d)          :crit, w6, after w4, 4d
    W8 Load content (2d)       :crit, w8, after w6, 2d
    W9 Launch QA (3d)          :crit, w9, after w8, 3d
    PB Project Buffer (CAP 23d):crit, pb, after w9, 23d
    section Feeding Chain 1
    W3 Design mockups (4d)     :w3, 3, 4d
    FB1 Feeding Buffer 1 (1d)  :active, fb1, after w3, 1d
    section Feeding Chain 2
    W1 Content outline (3d)    :w1, 1, 3d
    W2 Draft copy (5d)         :w2, after w1, 5d
    W7 Edit copy (3d)          :w7, after w2, 3d
    FB2 Feeding Buffer 2 (1d)  :active, fb2, after w7, 1d
4. Comparison of Buffer Calculation Methods
ccpm-scheduler supports three buffer sizing strategies. Here is how they impact the scheduled timeline and promise date for this project:
# 1. Cut & Paste (CAP) - Default
ccpm-scheduler build tasks.csv resources.csv --buffer-method cap --title "Website Launch"

# 2. 50% Rule (HCHAIN)
ccpm-scheduler build tasks.csv resources.csv --buffer-method hchain --title "Website Launch"

# 3. Root-Squared Error (RSEM)
ccpm-scheduler build tasks.csv resources.csv --buffer-method rsem --title "Website Launch"
Buffer Sizing Summary Table
| Method | Formula | Active Work (CC) | Project Buffer (PB) | Feeding Buffers (FB) | Promised Completion | Lead Time Reduction vs. CPM |
|---|---|---|---|---|---|---|
| CPM (Traditional) | Padded estimates | 46 days | 0 days | None | Day 46 | Baseline |
CCPM (cap) |
sum(realistic - optimal) |
23 days | 23 days | FB1 (1d), FB2 (1d) | Day 46 | Same promise date, fully protected |
CCPM (hchain) |
ceil(0.5 * sum(optimal)) |
23 days | 12 days | FB1 (1d), FB2 (1d) | Day 35 | 11 days faster (24% lead-time reduction) |
CCPM (rsem) |
ceil(sqrt(sum(delta^2))) |
23 days | 12 days | FB1 (1d), FB2 (1d) | Day 35 | 11 days faster (24% lead-time reduction) |
5. Generated Output Telemetry (summary.md)
Below is the actual summary.md generated by ccpm-scheduler build using the default cap method:
# Website Launch — CCPM schedule

- **Critical chain**: [W5 Build backend](https://example.com/tickets/W5) → [W4 Build frontend](https://example.com/tickets/W4) → [W6 Integrate](https://example.com/tickets/W6) → [W8 Load content](https://example.com/tickets/W8) → [W9 Launch QA](https://example.com/tickets/W9)
- **Critical chain length**: 23 working days (work finishes day 23)
- **Project buffer**: 23 days → **promised completion: day 46**
- **Buffer sizing**: CAP (Cut & Paste: buffer = Σ safety removed from the chain) — 5 of 5 critical-chain tasks have derived (single-point) safety estimates

| Feeding buffer | Protects | Size (days) | Derived estimates | Merges into |
|---|---|---|---|---|
| FB1 | [W3 Design mockups](https://example.com/tickets/W3) | 1 (method wanted 4) | 1 of 1 | start of [W4 Build frontend](https://example.com/tickets/W4) |
| FB2 | [W1 Content outline](https://example.com/tickets/W1) → [W2 Draft copy](https://example.com/tickets/W2) → [W7 Edit copy](https://example.com/tickets/W7) | 1 (method wanted 11) | 3 of 3 | start of [W8 Load content](https://example.com/tickets/W8) |

Durations are optimal (padding-free) estimates; overruns are expected roughly half the time and consume buffer — the promise date only moves if a buffer runs dry. Work the critical chain relay-runner style: hand off immediately, no multitasking.
6. Output Schedule Table (schedule.csv)
The schedule table generated by ccpm-scheduler specifies exact start/finish dates, row types, resource assignments, and buffer placement:
id,name,type,chain,start,finish,duration,realistic_duration,resource_ids,predecessor_ids,url
W5,Build backend,task,critical,0,8,8,16,dev,,https://example.com/tickets/W5
W1,Content outline,task,feeding-2,1,4,3,6,writer,,https://example.com/tickets/W1
W3,Design mockups,task,feeding-1,3,7,4,8,designer,W1,https://example.com/tickets/W3
W2,Draft copy,task,feeding-2,4,9,5,10,writer,W1,https://example.com/tickets/W2
FB1,Feeding buffer 1,feeding_buffer,feeding-1,7,8,1,,designer,W3:FB,
W4,Build frontend,task,critical,8,14,6,12,dev,W3:FB;W5,https://example.com/tickets/W4
W7,Edit copy,task,feeding-2,9,12,3,6,editor,W2,https://example.com/tickets/W7
FB2,Feeding buffer 2,feeding_buffer,feeding-2,12,13,1,,writer,W7:FB,
W6,Integrate,task,critical,14,18,4,8,dev,W4,https://example.com/tickets/W6
W8,Load content,task,critical,18,20,2,4,writer,W6;W7:FB,https://example.com/tickets/W8
W9,Launch QA,task,critical,20,23,3,6,qa,W8,https://example.com/tickets/W9
PB,Project buffer,project_buffer,critical,23,46,23,,,W9:PB,
7. Generating Visualizations
You can generate Gantt chart image plots and interactive HTML dependency graphs with single commands:
# Render buffer-aware Gantt chart image
ccpm-scheduler plot plan/schedule.csv plan/gantt.png --resources resources.csv

# Render interactive HTML dependency network
ccpm-scheduler graph plan/schedule.csv plan/project-network.html \
    --tasks tasks.csv --title "Website Launch"
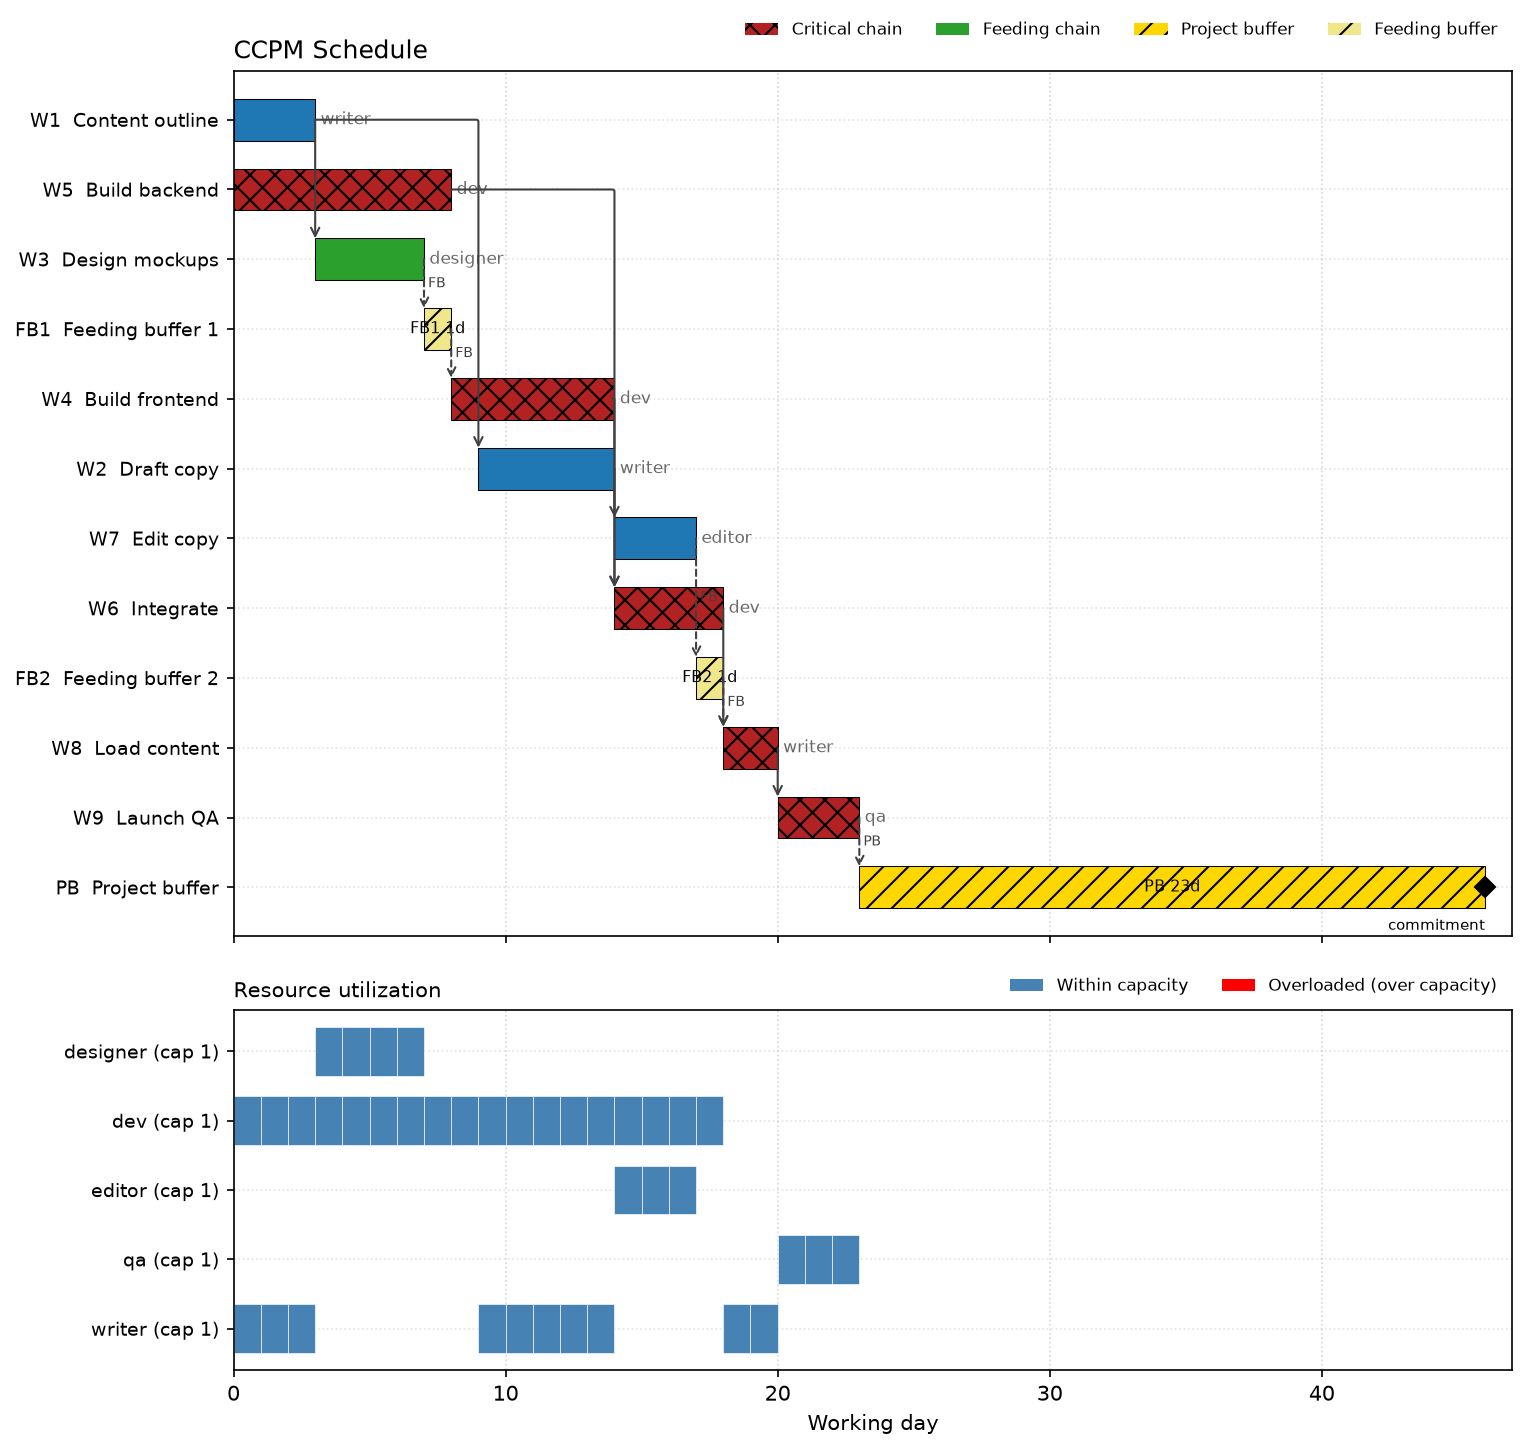
Generated Gantt Chart Image (gantt.png)
Below is the visual Gantt chart plot generated by ccpm-scheduler plot, displaying task schedules, Critical Chain highlights, feeding and project buffers, and per-resource utilization tracks:
Interactive Project Network Graph (project-network.html)
- Interactive Network View: Open the standalone Interactive Project Network Graph to explore tasks, predecessor/successor dependency links, buffer placement, and color-coded chain designations.
For more details on network algorithms and buffer mechanics, explore the Core Concepts and Network Layout Engine sections.